Do you often see this setting in your smartphone or digital camera and what is that?
Here is all the information bout this setting and it can help you to elevate your photography.
What are histograms?
A histogram is a feature that may help you determine the correct exposure for your shot.
A histogram is a bar graph representing a frequency distribution, with the widths of the bars corresponding to the classes into which the variables have been divided and the heights of the bars corresponding to the class frequencies.
If you’re having trouble understanding it, just remember that histograms graphically display the tonal values of your image. It displayed the pixels in your photograph that were exposed to light.
Reading a Histogram
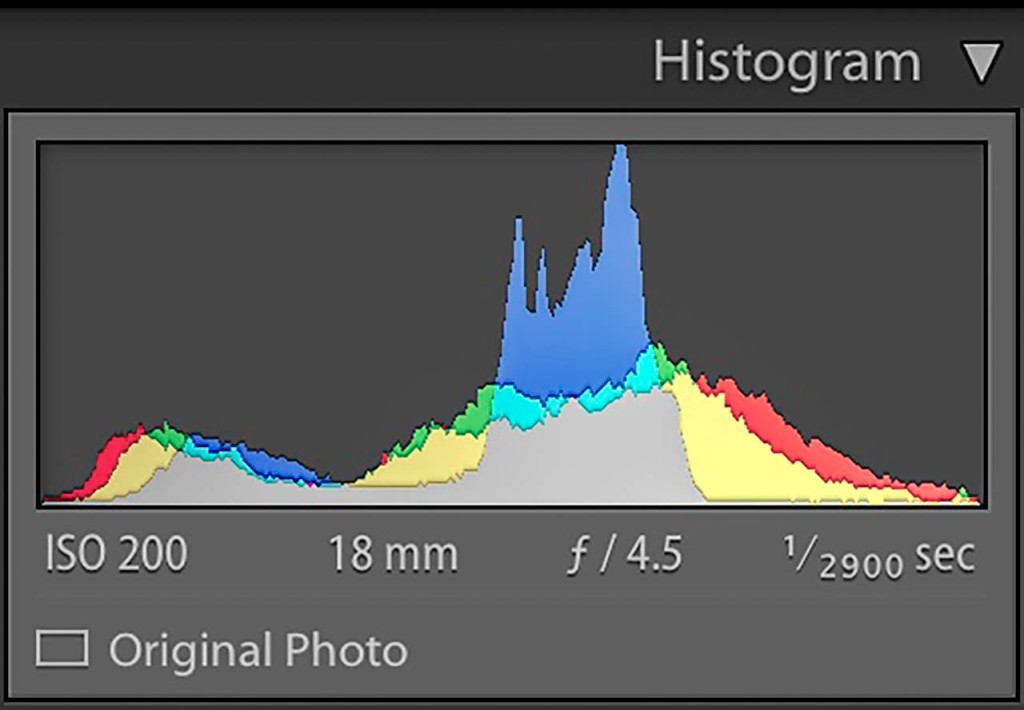
Different areas of a histogram’s graph exhibit different messages.
The graph’s left side represents shadows and blacks (low light), the right side represents highlights and bright sides, the Centre region represents mid-tones, and the peaks on the graph indicate the total number of pixels in that specific zone.

The histogram offers extensive information about the number of tones of varied brightness identified in your photo, ranging from black (100%) to white (100%) brightness.
We may use it to precisely fine-tune and evaluate our exposure.
Histograms are frequently shown in a variety of colours. Modern digital cameras include four sorts of histograms: luminosity histograms, red-sensitive pixels, blue-sensitive pixels, and green-sensitive pixels.
Because they are presented in their various colors, the last three histograms are referred to as color histograms.
The luminance histogram is the most basic and often used histogram. The histogram appears when you press the display, info, or directional menu-pad buttons on most cameras.
If you can’t open it using these ways, you can look for it under the manual settings.
The histogram graph shows how much of the situation will be recorded as a shadow, how much as a highlight, and how much will be somewhere in the middle.
It offers precise information on the exposure of the camera.
When you choose the manual mode and manually configure your camera’s aperture, shutter speed, and ISO, the histogram graph will show you specifics of exposure and you can simply assess if the brightness is correct or it is over-exposed / under-exposed.
Elements of Histogram
Three elements are necessary to successfully use the histogram feature:
- Understanding how to read a histogram
- Knowing what type of brightness, darkness, and contrast your image requires
- Understanding what you’re attempting to create
Final Words
It is necessary to learn how to interpret a histogram in order to make better use of it. Understanding what your graph depicts will help you better understand combinations.
When the bulk of the graph is orientated to the right, it means your image is over-exposed, also known as high-key in technical language.
The photograph is under-exposed or low-key, as shown by the bulk of the graph body to the left. If the bulk of the graph is in the center, it suggests that the shot contains id tones. It is a U-shaped graph.
